Big Data
Choose one of the following five examples of information design and analyse its effectiveness


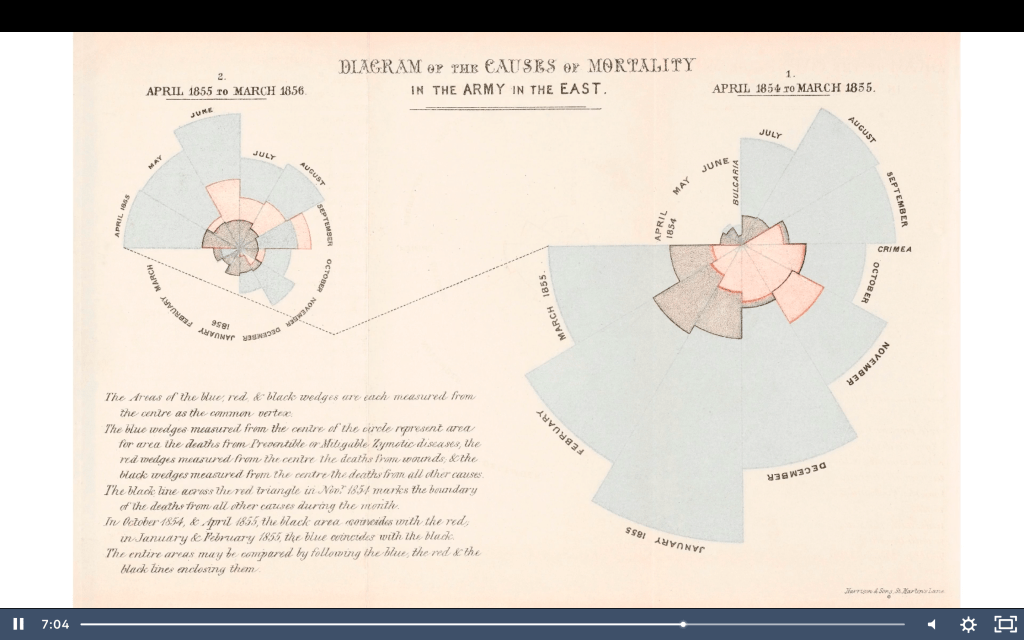
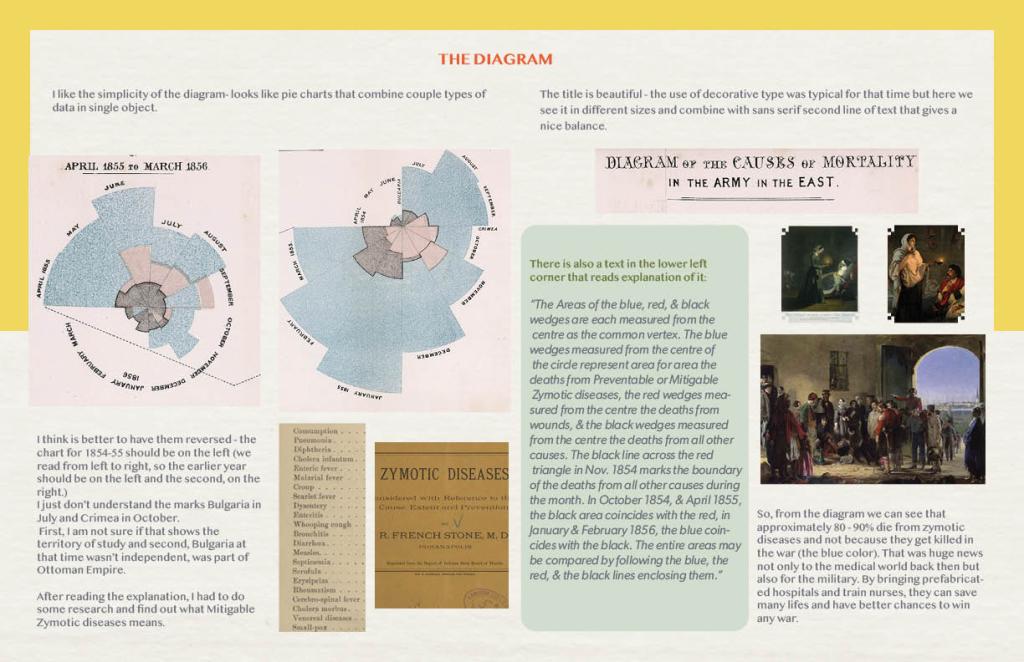
I pick the first one -created by Florence Nightingale in 1855 using the style she developed called the Rose Diagram
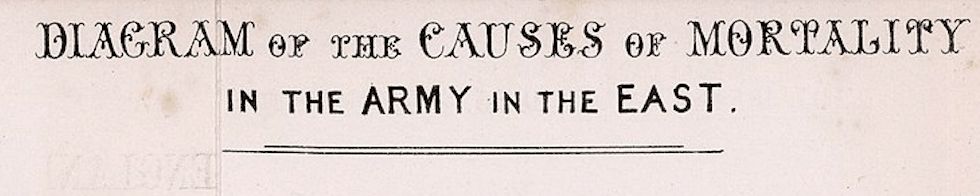
Diagram of the causes of mortality in the army in the East” by Florence Nightingale

Research
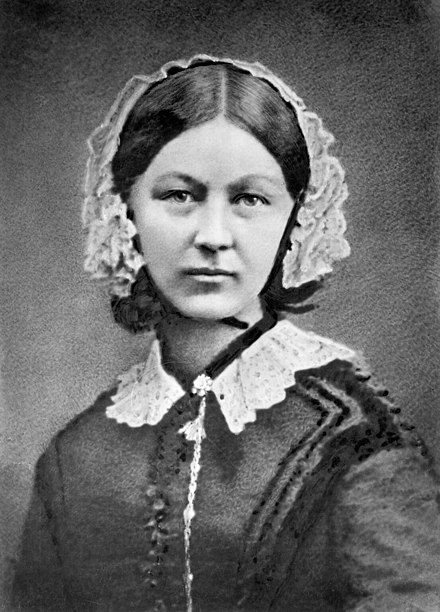
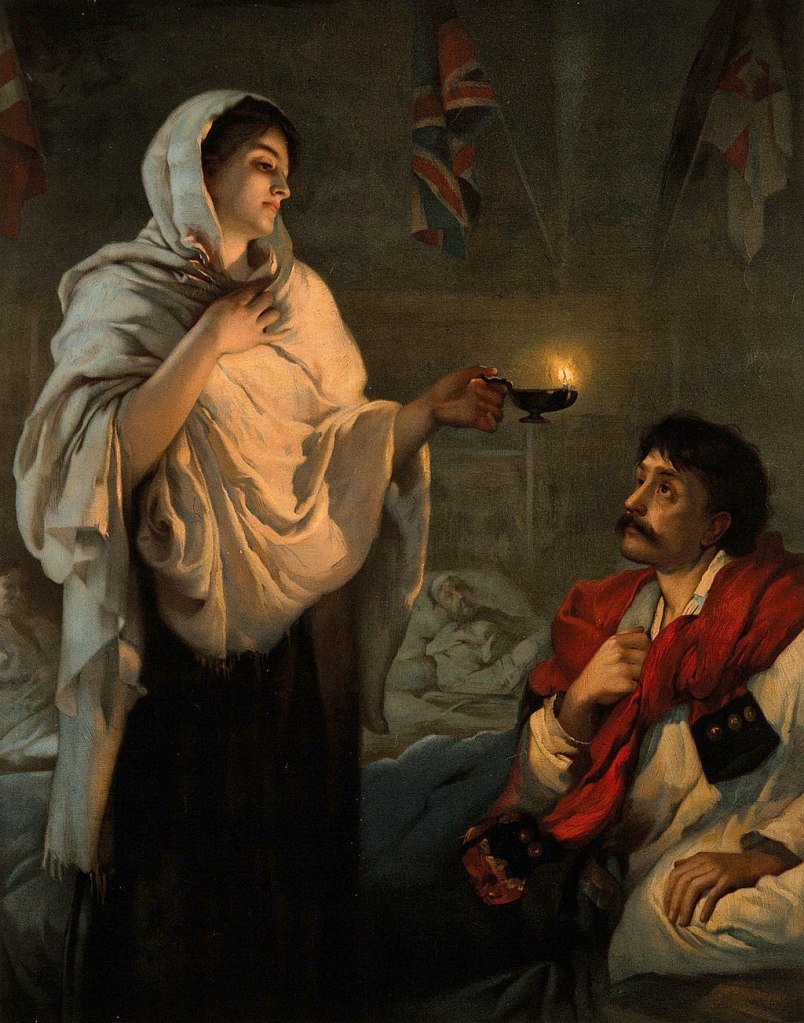
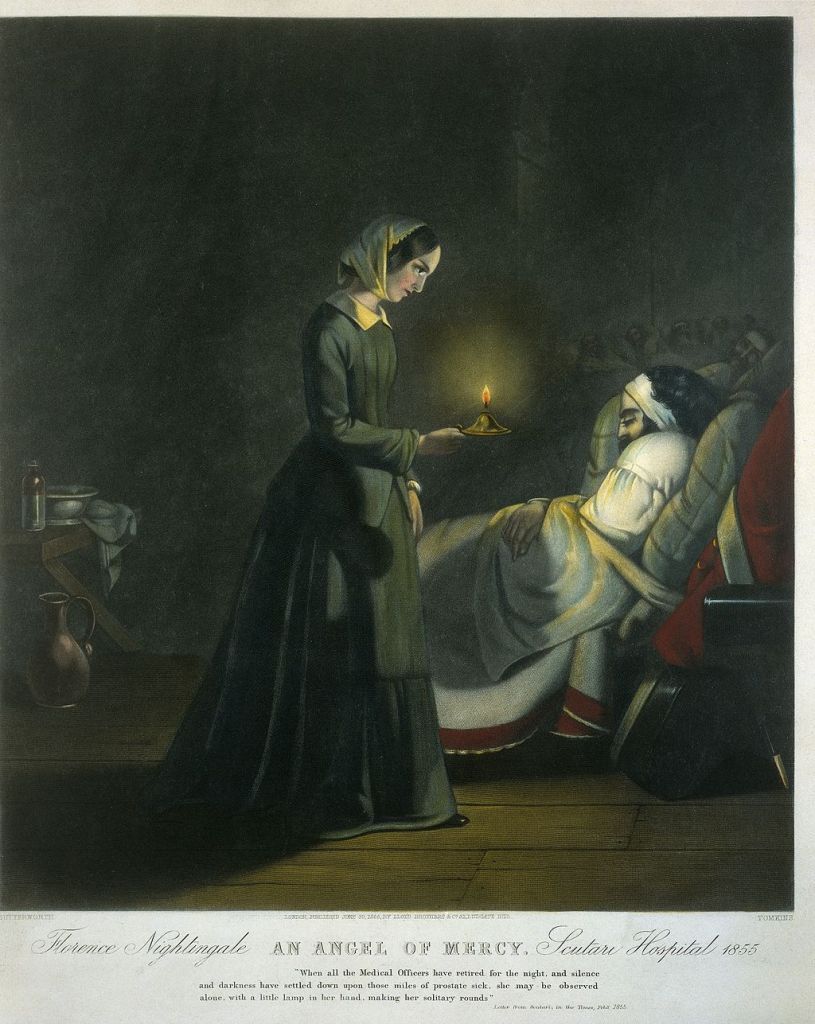
Florence Nightingale was an English social reformer, statistician and the founder of modern nursing. Nightingale came to prominence while serving as a manager and trainer of nurses during the Crimean War, in which she organized care for wounded soldiers at Constantinople. She significantly reduced death rates by improving hygiene and living standards. Nightingale gave nursing a favorable reputation and became an icon of Victorian culture, especially in the persona of “The Lady with the Lamp” making rounds of wounded soldiers at night.
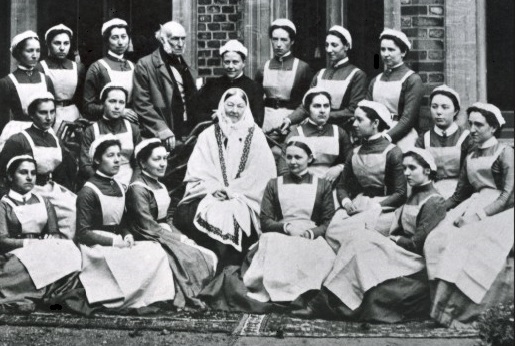
In 1860, she laid the foundation of professional nursing with the establishment of her nursing school at St Thomas’ Hospital in London. It was the first secular nursing school in the world and is now part of King’s College London.
In recognition of her pioneering work in nursing, the Nightingale Pledge taken by new nurses, and the Florence Nightingale Medal, the highest international distinction a nurse can achieve, were named in her honor, and the annual International Nurses Day is celebrated on her birthday.
Nightingale was a pioneer in statistics; she represented her analysis in graphical forms to ease drawing conclusions and actionables from data. She is famous for usage of the polar area diagram, also called the Nightingale rose diagram, equivalent to a modern circular histogram. This diagram is still regularly used in data visualisation.
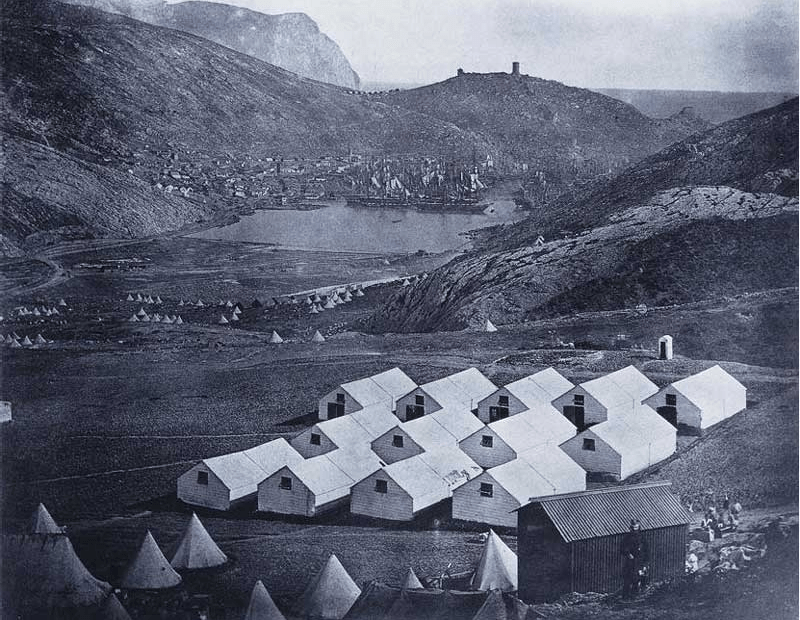
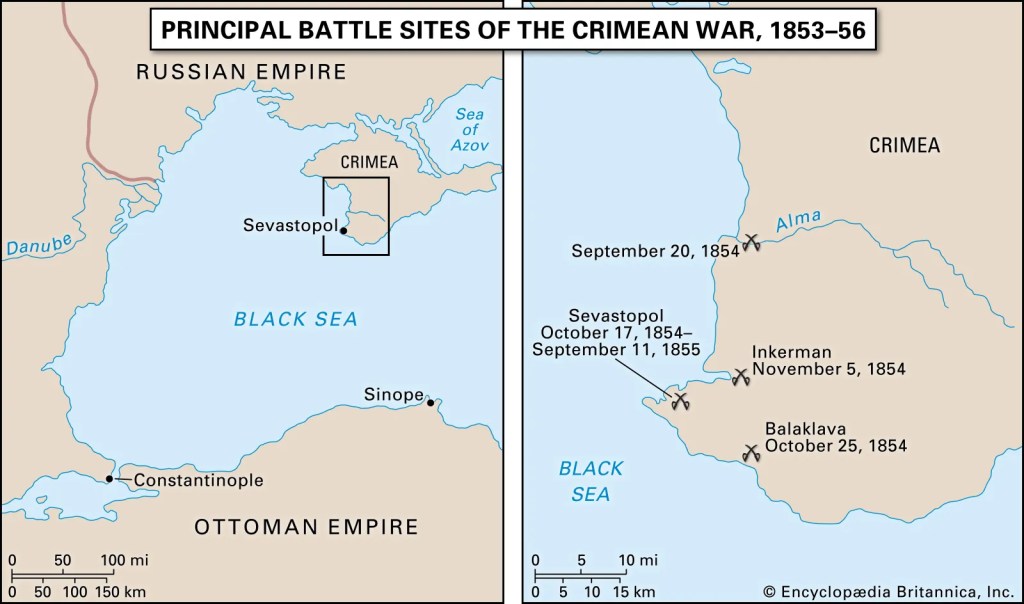
Florence Nightingale’s most famous contribution came during the Crimean War, which became her central focus when reports got back to Britain about the horrific conditions for the wounded at the military hospital on the Asiatic side of the Bosporus, opposite Constantinople, at Scutari (modern-day Üsküdar in Istanbul). Britain and France entered the war against Russia on the side of the Ottoman Empire.
Nightingale arrived at Selimiye Barracks in Scutari early in November 1854. Her team found that poor care for wounded soldiers was being delivered by overworked medical staff in the face of official indifference. Medicines were in short supply, hygiene was being neglected, and mass infections were common, many of them fatal. There was no equipment to process food for the patients.
After Nightingale sent a plea to The Times for a government solution to the poor condition of the facilities, the British Government commissioned Isambard Kingdom Brunel to design a prefabricated hospital that could be built in England and shipped to the Dardanelles. The result was Renkioi Hospital, a civilian facility that, under the management of Edmund Alexander Parkes, had a death rate less than one tenth of that of Scutari.
During her first winter at Scutari, 4,077 soldiers died there. Ten times more soldiers died from illnesses such as typhus, typhoid, cholera, and dysentery than from battle wounds. With overcrowding, defective sewers and lack of ventilation, the Sanitary Commission had to be sent out by the British government to Scutari in March 1855, almost six months after Nightingale had arrived. The commission flushed out the sewers and improved ventilation.Death rates were sharply reduced, but she never claimed credit for helping to reduce the death rate.
https://en.wikipedia.org/wiki/Florence_Nightingale

Who fought the Crimean War?
The Crimean War was fought between Russia and the forces of Britain, France, and the Ottoman Empire, later joined by the army of Sardinia-Piedmont.
What led to the Crimean War?
The Crimean War was the result of Russian demands to exercise protection over the Orthodox subjects of the Ottoman sultan. Another cause was a dispute between Russia and France over the privileges of the Russian Orthodox and Roman Catholic churches in Palestine. More broadly, struggles between the great powers in the Middle East led to war.
What was the outcome of the Crimean War?
After Austria threatened to join the allies during the Crimean War, Russia accepted preliminary peace terms in 1856. The Congress of Paris worked out the final settlement. The resulting Treaty of Paris, signed on March 30, 1856, guaranteed the integrity of Ottoman Turkey and obliged Russia to surrender southern Bessarabia at the mouth of the Danube.
How many people died in the Crimean War?
The Crimean War produced about 500,000 total casualties, with about half suffered by each side. A disproportionate number of deaths were caused by disease.
How did the Crimean War affect the future treatment of wounded soldiers?
After details of the deplorable conditions faced by wounded soldiers during the Crimean War reached the British public, nurses such as Mary Seacole and Florence Nightingale worked to improve their medical care. Their work paved the way for later developments in battlefield medicine.
https://www.britannica.com/event/Siege-of-Sevastopol

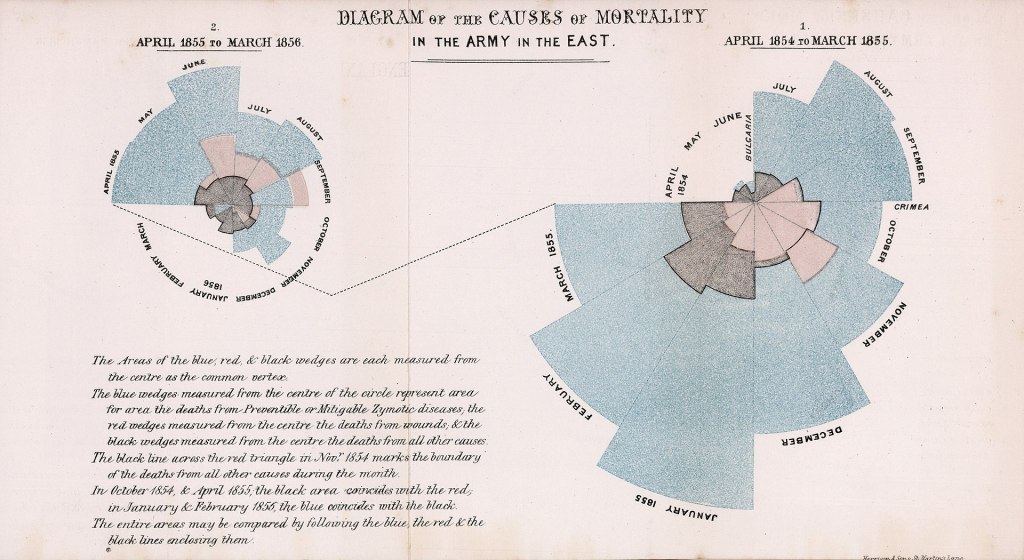
The diagram created in 1855 by Florence Nightingale is using the style that she developed and is called the Rose Diagram. Is representing visually the cause of mortality in the army in the East during the Crimean War (1853 – 1856). The war started from the conflict of great powers in the Middle East and was more directly caused by Russian demands to exercise protection over the Orthodox population in the Ottoman Empire. The Crimean War was managed and commanded very poorly on both sides. Disease accounted for the approximately 250,000 casualties lost by each side.
Florence Nightingale was an English social reformer, statistician and the founder of modern nursing. On 21 October 1854, Florence Nightingale and the staff of 38 women volunteer nurses that she trained were sent to the British camp in Scutari. After she arrived, she had to deal with many obstacles – short supply of medicines, neglected hygiene, no equipments to process food for the patients, and many infections that were fatal most of the time. The poor care of the soldiers was a reason for high death rate. That encourage Florence to do something about it. Her first step was to contact the leaders in England and ask for help. This was done mostly by collecting money from donations. Meanwhile, she was putting her mathematical skills in use by trying to simplify all the data that she was gathering about the reasons of death around. That’s how she came up with the diagram about the mortality of war, witch had historical significance not only in the medical field but also in the statistics and design world.
I like the simplicity of it – looks like pie charts that combine couple types of data in single object.
I think is better to have them reversed – the chart for 1854-55 should be on the left (we read from left to right, so the earlier year should be on the left and the second, on the right.) I just don’t understand the marks Bulgaria in July and Crimea in October. First, I am not sure if that shows the territory of study and second, Bulgaria at that time wasn’t independent, was part of Ottoman Empire.
The title is beautiful – the use of decorative type was typical for that time but here we see it in different sizes and combine with sans serif second line of text that gives a nice balance.
There is also a text in the lower left corner that reads explanation of it:
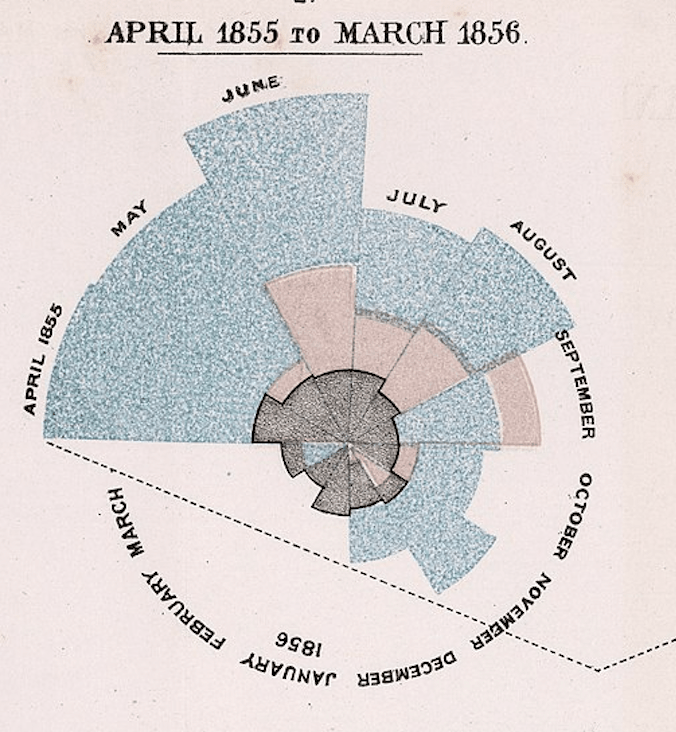
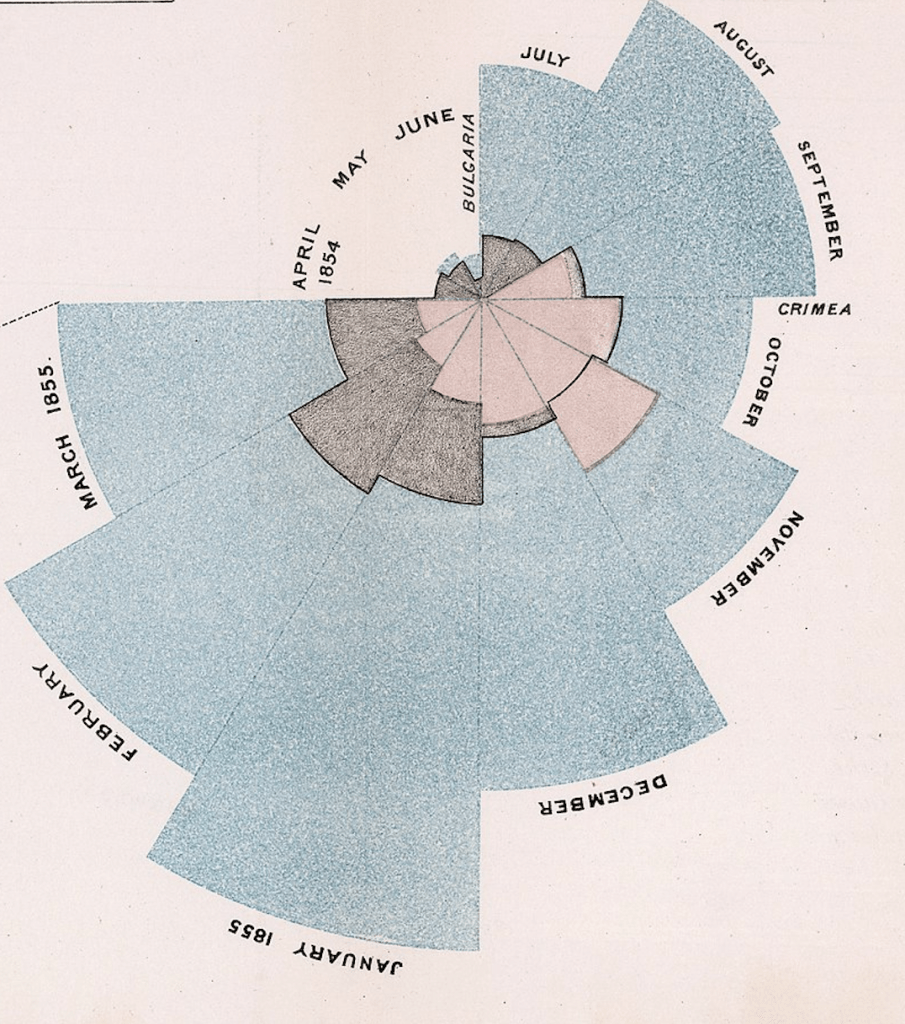
The Areas of the blue, red, & black wedges are each measured from the centre as the common vertex. The blue wedges measured from the centre of the circle represent area for area the deaths from Preventable or Mitigable Zymotic diseases, the red wedges measured from the centre the deaths from wounds, & the black wedges measured from the centre the deaths from all other causes. The black line across the red triangle in Nov. 1854 marks the boundary of the deaths from all other causes during the month. In October 1854, & April 1855, the black area coincides with the red, in January & February 1856, the blue coincides with the black. The entire areas may be compared by following the blue, the red, & the black lines enclosing them.”
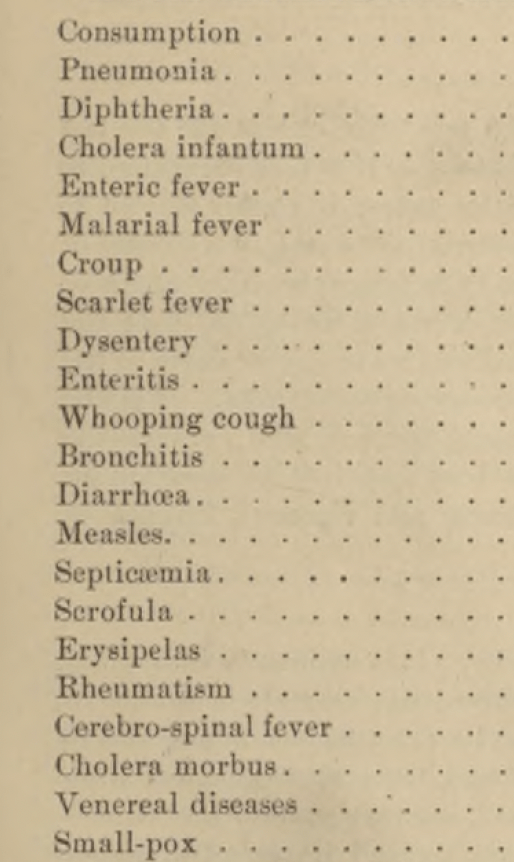
After reading the explanation, I had to do some research and find out what Mitigable Zymotic diseases means.
So, from the diagram we can see that approximately 80 – 90% die from zymotic diseases and not because they get killed in the war (the blue color). That was huge news not only to the medical world back then but also for the military. By bringing prefabricated hospitals and train nurses, they can save many lifes and have better chances to win any war.


Leave a comment